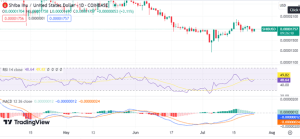
Meme coin Shiba Inu (SHIB) is currently grappling with a rough ride in the cryptocurrency market. SHIB sells for $0.00001732, which has gone down by 1.93% within one day. This decline reflects a more general movement in the meme coin space that has seen significant price fluctuations lately.
With its market cap of approximately $10.21 billion, this meme coin ranks among the most valuable cryptocurrencies. Despite the recent fall, trading volumes have increased by more than 19%, equivalent to a strong trading activity of $256.21 million over the last twenty-four hours.

RSI oscillates around 52 levels which are generally considered neutral. This means that Shiba Inu is at equilibrium neither on an overbought nor oversold scale and can go either way for either a potential rally or further corrections. The MACD signals for SHIB show the signal line slightly below the MACD line suggesting it could be bearish
Shiba Inu Trades Above Amidst WazirX Hack Impact and ETF Optimism
SHIB has been trading just above its support level demonstrating cautious investor sentiment following recent market developments. Prices of SHIB dipped after hackers made away with a significant amount of this meme coin during the WazirX hack incident. The incidence has led to considerable erosion in investor’s confidence as shown by substantially lowering future open interest on Shiba Inu futures contract Closing prices According to CoinGlass’ data from mid-March until late July future open interest for SHIB had declined significantly since July 19th when they were hacked.
The reduction of open interest indicates reduced speculative activity and a general bearishness among traders.
Though challenges still loom large ahead, there may be some light at the end of the tunnel for Shiba Inu. Lucie reacted to BlackRock’s ETHA promotional video stating that despite continued FUD (Fear, Uncertainty, and Doubt) from critics, the emergence of a BlackRock Ethereum ETF video could serve as an inflection point.
Future Price Predictions and Key Resistance Levels
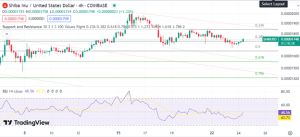
SHIB has established a base at the $0.00001720 level after making higher lows since July 8th. Important technical indicators such as Fibonacci retracements show SHIB retrace back to the 0.382 level that had been resistance around $0.00001820.

Price action within the descending channel provides a hint that consolidation might continue. However, if SHIB breaks above the $0.00001800 resistance line on a sustained basis it may indicate a bullish reversal with the next immediate hurdle being at $0.00001900. Conversely, if SHIB fails to hold above the $0.00001700 support, it may retest lower levels around $0.00001620 corresponding to a 61% Fib retracement level.
There is firm resistance at $0.00002000 for Shiba Inu. A sustained push above it might indicate a wider market recovery, pushing prices towards higher levels of resistance Alternatively, SHIB may retest support areas around $0.00001650 if the bearish momentum persists.


