


Pepe (PEPE) has seen a notable decrease in its market value over the past 24 hours, with a 5.43% drop to $0.00001224. This decline reflects broader market trends affecting investor sentiment and market dynamics.
Looking at the price chart, Pepe encountered resistance around $0.00001295 early in the trading day, suggesting a temporary ceiling where sell pressure overcame buying momentum. After this peak, the price retreated but showed signs of potential reversal around the $0.00001220 mark, where it briefly stabilized.
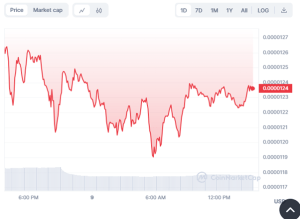

PEPE/USD 24hr Price Chart( Source: CoinMarketCap)
The trading volume of Pepe was also lower by 33.40%, at around $1.32 billion, which just confirmed that PEPE’s trading activity is reducing. Market capitalization followed, with a 3% slip to $15.15 billion. However, the circulating supply of PEPE remains constant at 420.69T, a crucial detail traders would like to know since this will affect price stability and probable price changes attributed to shifts in supply.
PEPE/USD Technical Analysis
Using Pepe’s 4-hour chart, the Awesome Oscillator (AO) notes that most of the bars forming are red. This supports the strength of a bearish move. However, the past two bars are green, and these changes potentially indicate a shift in momentum and are becoming bullish. The last registered AO value is around -0.00000155529, which still rests in negative territory but raises a sign of relief from downward pressure. This cross could signal a slowdown in selling activity and maybe the beginning of a bullish phase if buying interest remains.
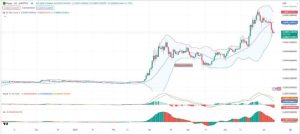

PEPE/USD 4-Hour Price Chart (Source: TradingView)
The price breaking below the lower band of Pepe 4-hour Bollinger Bands at the beginning of June 7th suggests a potential oversold condition. This break below the limit of that band is marked by the lowest price touching around $0.000011936301, where strong bearish momentum is exposed. The last candles are consolidating above this low, and the current price is about $0.000012357235, more or less on the lower band. This behavior suggests a stabilization phase may be underway as the price returns to the moving average.
The Moving Average Convergence Divergence (MACD) indicator on the Pepe 4-hour chart also signals a potential momentum shift. The MACD line has recently crossed above the signal line, a bullish signal often interpreted as a possible end to the previous bearish trend.
The MACD value has risen to 0.00000061512, and the signal line is currently at -0.000000598550. Moreover, the histogram, which visualizes the difference between the MACD and signal lines, has turned positive, registering at 0.000000537039. This change suggests growing bullish momentum, indicating that buyers may be gaining control, potentially leading to a sustained upward movement in the price.


