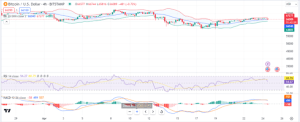
Bitcoin price analysis shows that BTC is currently trading at $66,585, up nearly 1% in the last 24 hours. The range for the day has been between $65,864 and $67,148, with a trading volume of $23 billion, slightly down from the previous day. Despite the slight decrease in volume, Bitcoin has demonstrated stability, maintaining a high trade volume consistently. This stability is reflected in its price, which has remained relatively steady around the $66,000 mark.
Bitcoin Gains But Sellers Still Have the Upper Hand
Bitcoin prices were restricted within a tight range on April 23. Even though the prior bull bar was trend-defining, breaking above local resistance levels, the failure of a firm confirmation should be a concern. The prices are now trading above the middle BB, and yesterday’s bar had a long lower wick suggesting strong demand. At spot rates, BTC is back within the multi-week range, where a key resistance level to watch is $74,000.
The BTC/USD pair in the 4-hour timeframe shows a period of consolidation following a volatile start to the month. The currency opened at 66,165 and saw a high of 67,049, while the low was recorded at 64,458, with a close at 67,562, suggesting a modest uptick in market valuation.

Notably, the price action is tightening within the Bollinger Bands, indicating reduced volatility as the market searches for direction. The Bollinger Band width, narrowing throughout the period, supports the consolidation narrative.
The Relative Strength Index (RSI) fluctuates slightly above the median line, currently at 59.23, indicating a balance between buying and selling pressures. This neutral sentiment is underscored by the Moving Average Convergence Divergence (MACD), where the signal line and the MACD line remain nearby, suggesting a lack of strong momentum. The MACD histogram reflects this as well, with bars oscillating around the baseline without significant divergence.


