Bitcoin has exhibited a strong recovery, soaring back above the $67,000 threshold. This remarkable rebound aligns with the Federal Reserve’s latest announcement to hold interest rates steady.This decision has seemingly fueled investor confidence in the cryptocurrency. After experiencing a slight downturn towards $62,082.5, Bitcoin’s value has surged by 5%.Bitcoin reached an intra day high of $68,199.99,before retracing lower to the current price of $67,053.94.
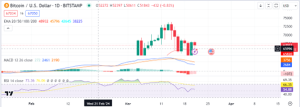
The daily chart analysis of the BTC/USD pair shows the 20 EMA sits at $67,075, which Bitcoin has successfully tested and held above, showing signs of a strong bullish trend.

However, the MACD on the daily chart suggests caution, with the MACD line still below the signal line, indicating that bullish momentum has room to grow. The daily RSI, currently at 66.35, remains in a neutral zone, providing neither overbought nor oversold signals.
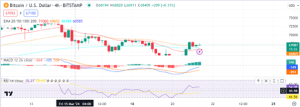
Bitcoin price analysis on a 4-hour chart shows a recovery from its recent lows. A key technical observation is the break above the Exponential Moving Averages (EMAs), with the 20 EMA now at $67,604, potentially turning from resistance to support.
Technical indicators suggest a bullish outlook, with Bitcoin’s price likely to find support around the $66,500 level. Should this level hold, a continuation of the upward trend is plausible, with resistance seen at the $68,000 mark. However, a failure to maintain support could lead to a retest of lower levels, with $65,000 serving as the next critical support zone.
The Moving Average Convergence Divergence (MACD) indicator displays positive momentum, as the MACD line crosses above the signal line, reinforcing bullish sentiments. The Relative Strength Index (RSI), currently at 62.52, indicates a healthy market without being overbought. Traders will be observing the $67,700 level closely, which if surpassed could see Bitcoin targeting the next resistance near the $68,500 level, where significant sell pressure and potential liquidation could come into play.

Investors are now looking at the $67,079 level as the immediate focal point, with a breach above this potentially enabling Bitcoin to test the higher resistance at $68,500. Conversely, support is established around $65,825, and maintaining above this level is crucial for continued bullish momentum.
BTC Price Breaks Out Of Downtrend Channel
Bitcoin has marked a notable breakout from a persisting parallel downtrend channel, drawing significant attention in the trading community. Renowned for his insightful analysis, Daan Crypto Trades recently discussed the importance of this development: “Bitcoin tested its 4H 200MA/EMA and has been holding nicely there and broke out. Still watching this channel which will dictate BTC’s next move.” This technical event could be pivotal for Bitcoin’s short-term trajectory.
#Bitcoin Tested its 4H 200MA/EMA and has been holding nicely there and broke out.
Still watching this channel which will dictate $BTC‘s next move.
Bulls would want to see this consolidate above and not fall back into the channel. pic.twitter.com/94etUo6YAR
— Daan Crypto Trades (@DaanCrypto) March 20, 2024
According to Daan’s observation, Bitcoin has been trapped within a downtrend channel for an extended period, exceeding a week. However, a vigorous push in the price resulted in a breakout above this channel. Presently, Bitcoin is undergoing what is known as a retest phase, where the price attempts to confirm the channel as a new support level. If this retest is affirmed, we could anticipate an accelerated price climb.
While technical indicators on the 4-hour and daily charts suggest a potential for continued upward movement, the looming possibility of a substantial liquidation event at the $68,500 level presents a cautionary note for investors.


