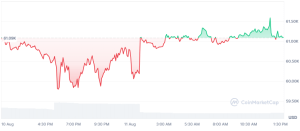
Bitcoin price has recovered despite a bearish trend earlier in the day. After the support was established at the intra-day low of $60,423.92, bulls swept in to seize market control. However the bullish steam waned after resistance at the 24-hour high of $61,778 proved too stiff to breach. At press time, BTC was exchanging hands at $61,139, a 0.50% surge from the intra-day low.

Source: CoinMarketCap
The day’s trading of Bitcoin was characterized by high levels of fluctuations. Following a dip to around $60,500, the price rallied, although this increase waned as it neared the $61,500 to $62,000 mark. Thus, such levels define Bitcoin’s short-term trend as evidenced by the market response.
The 24-hour trading volume for Bitcoin fell by 45.93%, which could be regarded as a clear indicator of a decrease in traders’ activity in the analyzed period. This reduction in the trading volume may be an indication of weak liquidity, and this may mean that it will be difficult for Bitcoin to maintain an upward trend. Nevertheless, the price has been anchored above the crucial support at $60,500, which may open the path for another shot at the $62,000 barrier.

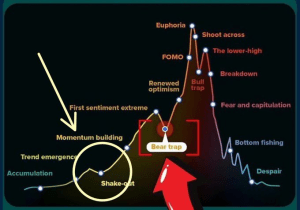
Consequently, some analysts such as Sensei also described the dip as a “shake-out” where weak investors are forced out of the market before a possible upward momentum.
Open Interest and Derivatives Market
Though the trading volume has reduced, open interest in Bitcoin derivatives has increased by 0.78% to $28.60 billion. This means that the traders are still sitting on their current positions possibly waiting for some better market direction before making their next move.

The options market recorded a sharp drop in trading volumes which fell by 64.55% to $502. 29 million. Nevertheless, the open interest in the options decreased only by 23% to $2111 trillion. This difference between volume and open interest means that although the number of new options contracts that are being traded is decreasing, existing ones are mostly being held by the market players, which shows that the market is in a state of waiting.
Key Support and Resistance Levels
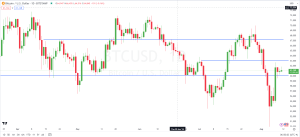
Currently, Bitcoin’s price is still fluctuating around the critical support level at $60,000- $61,000. This level has always been a critical zone, which has acted as both support and resistance in previous trading sessions. Continuous trading above this range could indicate a change in the trend towards the positive direction; however, the market is still cautious.

Source: TradingView
Bitcoin must however break through the next significant resistance level of $63,000 to continue the upward trend. Beyond that, the $67,000 to $68,300 range is another crucial level that can become a problem for the cryptocurrency as these levels have been critical resistance levels in the past. This price action is in line with previous trends where Bitcoin pauses during bear markets only to continue the downward trend.
However, according to crypto analyst Josh of Crypto World, Bitcoin’s current price trend mirrors previous market patterns, such as the one that occurred in March 2020, when Bitcoin bottomed out at two levels before a reversal. In this case, the price of Bitcoin fell and then slightly increased. Consequently, the anticipation lingers as questions arise of is whether this present relief rally will be a sustained trend or if the bearish forces will come back into play.


