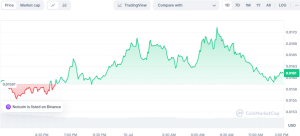
In the past 24 hours, Notcoin (NOT) has posted massive trading activity as one of the top game tokens on Telegram in the wake of general market recovery. The token was trading at $0.01614, meaning an increase of 2.38% from the intraday low. According to CoinMarketCap, Notcoin’s market capitalization currently stands at $1.6 billion as it continues to be traded at a volume of $502 million, which is down 44%.

Source: CoinMarketCap
Notcoin (NOT) Recent Performance
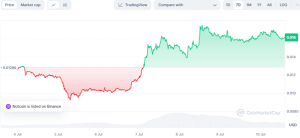
Notcoin started the week positively, building on gains made over the weekend. The token surged 15% over the weekend, from $0.00912 to highs of $0.01712. This rally faced headwinds just below the $0.017 mark. Notwithstanding that the value of the coin was shaved by 14% in the past month after touching an all-time high of $0.02896 on June 2nd, there is a small tentative recovery on Notcoin’s recent performance. The token has gained over 25% in just the past week, with trading priced at $0.009 to $0.017.

NOT/USD 7-day price chart
Price dynamics and trading volumes suggest that Notcoin price may be ready for a bullish trend. What is important now is that the token has managed to break above the descending channel pattern, which generally signals good upward price corrections. This surge could take the coin price to new highs of up to 80% in the next weeks. For Notcoin to continue to soar with this kind of upward momentum, the price has to be broken beyond the resistance at $0.017.
And if successful, the token may advance towards $0.035 and hit $0.050 shortly. Meanwhile, when the market is bearish, the price of Notcoin may stabilize at $0.016 or even fall to $0.012.
NOT/USD Technical Analysis
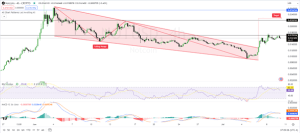
On the NOTUSD 4 hour price chart, a falling wedge pattern is observed, which generally is a bullish pattern in technical analysis. This is drawn from converging trendlines as price gradually makes lower highs and lower lows. The convergence generally implies that bearish momentum is weakening. The chart also shows some volatile price action, and a sharp tick up in price is breaking out of the wedge pattern. This could be taken as a bullish signal, hence giving the idea that possible continuation could take place to the upside if price manages to stay above the upper trend line of the wedge.
Consequently, if a recovery for the price starts, the current resistance levels would be $0.0220762 with a higher target of $0.0254744. At the last visible price point, Notcoin is changing hands at about $0.0157931. With bulls marching resolutely to keep the coin in an uptrend, it will be necessary to monitor whether there is a closed, sustained break above the wedge and the reaction of prices at the first resistance line.

Source: TradingView
Failure to hold onto these levels could result in a decline toward lower support levels, possibly around the wedge bottom. The Relative Strength Index is around 57.47, slightly at neutral but with a slight bullish hint. Any reading above 70 suggests overbought conditions, and below 30 suggests oversold conditions. The Moving Average Convergence Divergence line is below the signal line and has been maintained by the bearish crossover. However, the recent bars on the histogram indicate the likelihood of reduction in negative momentum, which can be a precursor to a bullish crossover if the trend continues.


