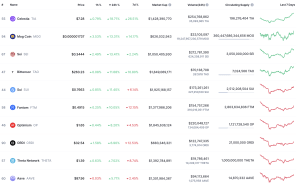
The Celetia (TIA) is leading the gains on Wednesday as all the wider crypto market experienced modest gains. TIA price is up 18.71% over the last 24 hours to trade at $7.28 as of 2:00 am ET.
With this performance, Celestia is the biggest gainer among the top 100 cryptocurrencies by market capitalization according to data from CoinMarketCap.

Top gainers Feb. 1. Source: CoinMarketCap
In comparison, the global crypto market capitalization is up 1.84% on the day to rest at $2.16 trillion. Bitcoin is up 3% to $59,250, and Ether’s ETH has increased by 1.1% to $3,112 over the same time period.
What are the key levels to watch out for Celstia in the long term?
Celestia price trades above a significant support zone
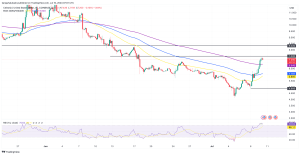
At the time of writing, TIA was fighting resistance from the psychological level at $7.5. A daily candlestick close above this level would suggest the ability of the buyers to sustain the higher levels.
These bulls will then be bolstered to push the price first toward the $8.0 psychological level and later the June 17 high at $8.3. Such a move would represent a 71.5% ascent from the current price.

TIA/USD four-hour chart. Source: TradingView
Supporting the bullish thesis for the TIA token was the position of the relative strength index (RSI) in the overbought region. The price strength at 74 suggests that the buyers are dominating the market.
Perhaps the most important technical indicator supporting Celestia’s upward thesis is the major support zone between $6.85 and $5.8. Note that this is where the 50-day exponential moving average (EMA), the 100-day EMA and the 200-day EMA lie.
As such, any attempts to pull the TIA price below this zone would be met by intense buying from buyers congested around this level, who would want to increase their profits.
Other levels to watch on the downside are the psychological levels at $5.5 and $5.0, and the range low at $4.8.


