AI-related coins have turned down from their recovery last week to record double-digit losses over the past 24 hours.
At a time when the largest cryptocurrency by market capitalization, BTC is struggling to hold above the $54,000 mark, recording its intra-day low of $53,500 on July 5, — most AI coins followed in its footsteps and experienced double-digit losses.
Before the current bearish brunt, this category of cryptocurrencies was among the biggest gainers in the green crypto market.

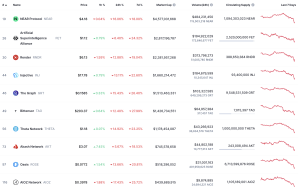
Performance of top AI coins. Source: CoinMarketCap
Near token (NEAR) mirrored the broader market trend, achieving a 16% price decrease in the past 24 hours. Fetch-Ai (FET) was also turned down, losing more than 6.4% of its value in the same time period.
The largest losses were experienced by AIOZ Network holders, whose token AIOZ lost more than 17.43% of its value in the last 24 hours. Other big losers among the top-cap AI coins were the Graph (GRT) and the Theta Network (THETA), which recorded 15.43% and 14.02% losses, respectively, over the same time period.
The latest sell-off in AI coins is driven by the sell-off in the wider crypto market field by the selling from the German government and repayments from the defunct crypto exchange Mt. Gox.
JUST IN: On-chain data confirms this is the second-largest liquidation event in #Bitcoin‘s entire history, right after the #FTX collapse in November 2022.
This comes amidst news that Germany is selling $3.5B worth of seized $BTC, and Mt. Gox begins paying back $8.5B to… pic.twitter.com/Cf1GJgU1ga
— WhaleWire (@WhaleWire) July 5, 2024
NEAR token at risk of 27% more losses to $3.05
After reaching a low of $4.42 on June 18, ETH price pulled up as buyers bought on the dip and the wider crypto market recovered.
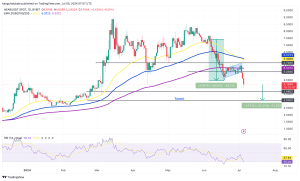
Despite the recovery, a bear flag can be seen on the daily chart, which hints at the continuation of the downtrend.
NEAR dropped below the support of the flag’s lower boundary at $5.094 on July 4. A daily candlestick close below this level would signal a possible downward breakout from the chart formation, projecting a drop to $3.05. Such a move would represent a 27% descent from the current price.

NEAR/USD daily chart. Source: TradingView
All the major moving averages and the relative strength index (RSI) were facing downward, suggesting that the market conditions still favored the downside. The price strength at 30 indicated that the bears still dominated the market.
Conversely, NEAR could rise from the current level toward the psychological level of $4.5 and later toward the flag’s lower boundary at $5.094. Additional barriers could emerge from the flag’s middle boundary at $5.33, embraced by the 200-day EMA and the upper boundary of the flag at $5.74.


