AI-related coins have turned down from their recovery to record double-digit losses over the past 24 hours.
At a time when the largest cryptocurrency by market capitalization BTC is struggling to hold above the $60,000 mark, recording its intra-day low of $60,580 on June 27, — most AI coins followed in its footsteps and experienced double losses. Before the current bearish brunt, this category of cryptocurrencies were among the biggest gainers in the green crypto market.
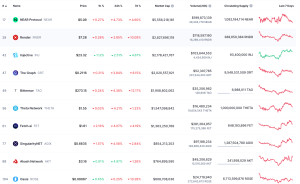
Performance of top AI coins. Source: CoinMarketCap
Near token (NEAR) mirrored the broader market trend, achieving a 4.73% price increase in the past 24 hours. Render (RNDR) was also turned down, losing more than 3.85% of its value in the same time period.
In contrast, Injective (INJK) saw significant progress, recording only more than 2.51% gains on the daily chart. The biggest casualties of the bearish price action are new AI cryptos that have emerged in the past few months.
Ai-based memecoin Turbo (TURBO) recorded a 12.26% drop on the 24-hour chart, while Numeraire (NMR) saw an 8.4% price decrease.
The recent rise in the prices of AI-based cryptocurrencies not only reversed the market trend but also helped these coins make it back into the news cycle after many called the recent dip the start of the AI frenzy.
🗞️ Crypto News
Artificial intelligence-related crypto tokens have soared over the past week, even as Nvidia, a key player in the AI space, experienced a significant drop in its market capitalization.
🔗 https://t.co/SrcKwS4pB3#CryptoNews
— CoinMarketCap (@CoinMarketCap) June 25, 2024
NEAR token risks 40% losses to $3.1
After reaching a low of $4.42 on June 18, ETH price pulled up as buyers bought on the dip and the wider crypto market recovered.
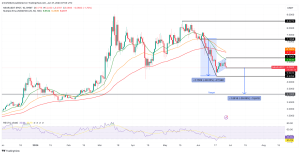
Despite the recovery, a bear flag can be seen on the daily chart, which hints at the continuation of the downtrend.
NEAR sits on support from the flag’s lower boundary at $5.04. A daily candlestick close below this level would signal a possible downward breakout from the chart formation, projecting a drop to $3.1. Such a move would represent a 39% descent from the current price.

NEAR/USD daily chart. Source: TradingView
All the major moving averages and the relative strength index (RSI) were facing downward, suggesting that the market conditions still favored the downside. The price strength at 35 indicated that the bears still dominated the market.
On the other hand, if the bulls push the price above the flag’s middle line at $5.5. Additional barriers could emerge from the flag’s upper limit at $5.65, embraced by the 50-day EMA and the $6/2 major resistance level – where the 200-day EMA and the 100-day EMA appear to converge. Bulls must overcome this buying pressure from this supplier congestion area before reaching the start of the flag’s pole at $7.16 and the May 17 swing high above $8.5.


