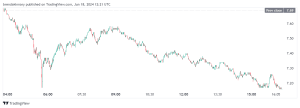
Toncoin (TON), the native token of The Open Network, is under considerable pressure in the market at the moment. It has risen to a maximum of $8.25 on June 15, TON has entered a correction period, testing key support levels in a highly volatile environment. According to the latest information, Toncoin is at $7.18, reflecting a 7.55% drop over the last 24 hours.
The cryptocurrency has been very volatile and has had a very high trading volume of $437,910,797 in the same period. This decline is in line with the general bearish trend that has been seen in the crypto market, but it has certain peculiarities in the case of TON

The technical analysis of Toncoin indicates that the token is in the testing phase as the price fluctuates around the key support level of $7.10, which is just a tad lower than the current trading price. This area is crucial; a breakdown below it could lead to more selling pressure and take the price to even lower levels. On the other hand, if TON is able to build up and recover from this level, it may suggest that the bearish trend has been temporarily halted and may result in a slight bounce.
The current market position indicates that TON has been fluctuating around the $7.50 mark, a stage that could determine the outcome of the game in case of a football match. If Toncoin goes beyond this level, it may act as a base for further increases and push the price towards other resistance levels. On the other hand, if TON falls below this point, it could drop to as low as $7.20 area, based on the current trading and technical analysis of the market.
TON Plunges to Lows of $7.18 Amidst Overwhelming Bearish Trends
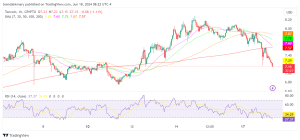
Analyzing the price fluctuations of Toncoin on the four-hour chart, it can be concluded that the price has been declining in the recent sessions, indicating a change in the market sentiment. Currently trading at $7.18, Toncoin has been trading lower than the recent high of around $7.87, which is still not able to sustain the upward movement. This trend is marked by a sequence of lower highs and lower lows, which is suggestive of mounting bear pressure.

The chart shows Toncoin trading below all the major Simple Moving Averages (SMAs) including the 7 SMA, 30 SMA, 50 SMA, 100 SMA, and 200 SMA, which is bearish. These averages are currently aligned in a bearish manner with the short-term SMAs located below the longer-term SMAs further supporting the bearish trend.
The RSI, placed at 28.33, is well into the oversold territory, meaning that the price may soon face corrective pressure if the bearish sentiment continues. Normally, when the RSI is below 30, it is a signal that the asset may be oversold and could bounce back if buyers return to the market. However, traders should be careful because the selling pressure can maintain the RSI in the oversold territory for longer than anticipated.
As it stands, the price is in a bearish trend and the first level of resistance to look at is $7.29, which is in line with the 7-period SMA. A bullish candle close above this level may signal a short-term bullish reversal that could take the price towards $7.60 area, which is the next resistance cluster created by higher SMAs. On the other hand, if the selling pressure increases and the price cannot hold above the support at $7.18, we could see further declines towards the $7.00 psychological mark.
In the near term, the primary concern for TON traders will be how the price behaves around the current support levels. An aggressive stance above $7.50 could help to attract more buyers and change the dynamics to a positive one. On the other hand, sustained pressure below this level may result in more selling, challenging the next support around $7.20.


