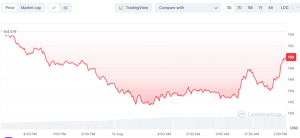
Over the past 24 hours, Solana (SOL) has ended up in a bearish rally, with prices fluctuating between an intra-day high of $155.44 and an intra-day low of $141.35. The cryptocurrency is exchanging hands at $147.50, representing a 5.02% fall within the last day.

SOL/USD price chart (CoinMarketCap)
This SOL decline has been accompanied by a decrease of 4.99% in the market capitalization bringing it to around $68.84 billion. However, trading volume has surged by 125.77%, hitting about $3.08 billion, reflecting increased activities on the market amidst changing prices.
Resistance and Support Levels Signal Market Uncertainty
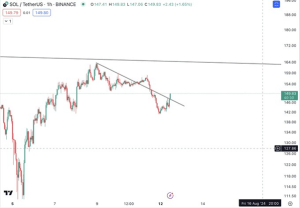
In this case, Solana meets immediate resistance near the level of $148, thus confirming that resistance. The resistance line is descending and extends from August 7th, starting at some higher points and ending at recent peaks.
A break beyond this trend line would mean that the market sentiment will potentially switch from bearish to bullish since it acts as a crucial barrier touching on all those points. For now, price action continues oscillating around $147, implying volatility with buying pressure emerging at lower levels, particularly towards earlier seen support level of around $144.

The $144 support area is becoming crucial for traders in the event it breaks down further southwards, setting another push for bears’ attack or potentially continuing the downtrend with no pullback for bulls moving down to recover control again. Nevertheless, investor caution still prevails as traders carefully watch price behaviour near these strategic prices.
SOL Potential Breakout and Entry Points for Traders
TheCryptomist believes there is a breakout case if Solana can close above this descending trend line acting as resistance.
The next confirmation will be when there is a confirmed breakout within that range below major volume zones, approximately from the $148-$150 level where longs may enter.In this scenario, the first target aims at $164, which may match previous resistances or Fibonacci extension patterns.
The price of #solana is approaching the resistance of this range.
Once $SOL breaks above $190 it will likely explode to the upside. pic.twitter.com/xbu7ljn8Iq
— CryptoJack (@cryptojack) August 11, 2024
For example, the second target ($185) could be due to previous or some other level of resistance tested on the chart formed by extensions of prices. In such a volatile market, however, risks should be managed by using stop-loss orders below $190 or recent swing lows.
Bearish Scenario: Potential Drop Below Support Levels
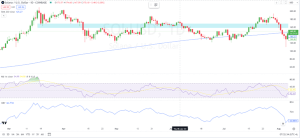
On the downside, Solana’s price is under severe downward pressure, falling from above $160 to near $147 recently. If bears can push down its value below $140, token analysts predict it will indirectly retest its lower support region. As bearish momentum continues towards the major support level at $133, a prolonged consolidation could be expected.

SOL/USD (TradingView)
This has been supported further by the On Balance Volume (OBV) indicator which indicates that there is potential for more downside movements in prices.
Despite some bullish bounces, such as the one driven by the Relative Strength Index (RSI), the overall picture still suggests that unless there is an impressive recovery beyond $150, the price will keep facing downward pressure. Conversely, if crucial supports fail to hold up well during this period of sell-off pressures that would result in a decline of Solana price


